Zombie Halloween
How to read our results
The numbers in our experiments come from a specific measurement procedure: we take 100-token sequences throughout a book (every 10 characters, from start to end), and compute the extraction probability of the last 50 tokens (the suffix) given the first 50 tokens (the prefix). This method is called probabilistic extraction.
The claims we make about memorization are specific to this setup, including the decoding policy we use (top-k sampling with k = 40 and temperature 1). Other settings may reveal different memorization: different prompting strategies (e.g., longer prefixes or adversarial prompts), other decoding policies, or other success conditions (e.g., near-verbatim matching).
It's worth remembering that extraction is the observable signal we measure, while memorization is the underlying property of the model that we use this signal to probe. Different setups may capture different signals, but as long as the setup is valid, each one reveals some subset of what the model has memorized.
Model groups
We arrange our results into three groups of models, based on what we know about their training data.
Extraction coverage by model
Extraction coverage is the fraction of the book that's memorized. More precisely, it's the share of the book's characters that fall within at least one 50-token suffix that we extract from the model (extraction probability at least 0.1%). We show coverage for each of the 14 models; longer bars mean more of Zombie Halloween is memorized. (High coverage doesn't mean the whole book can be generated at once; it's a way to compare how much is memorized across books and models.)
Memorization heatmaps
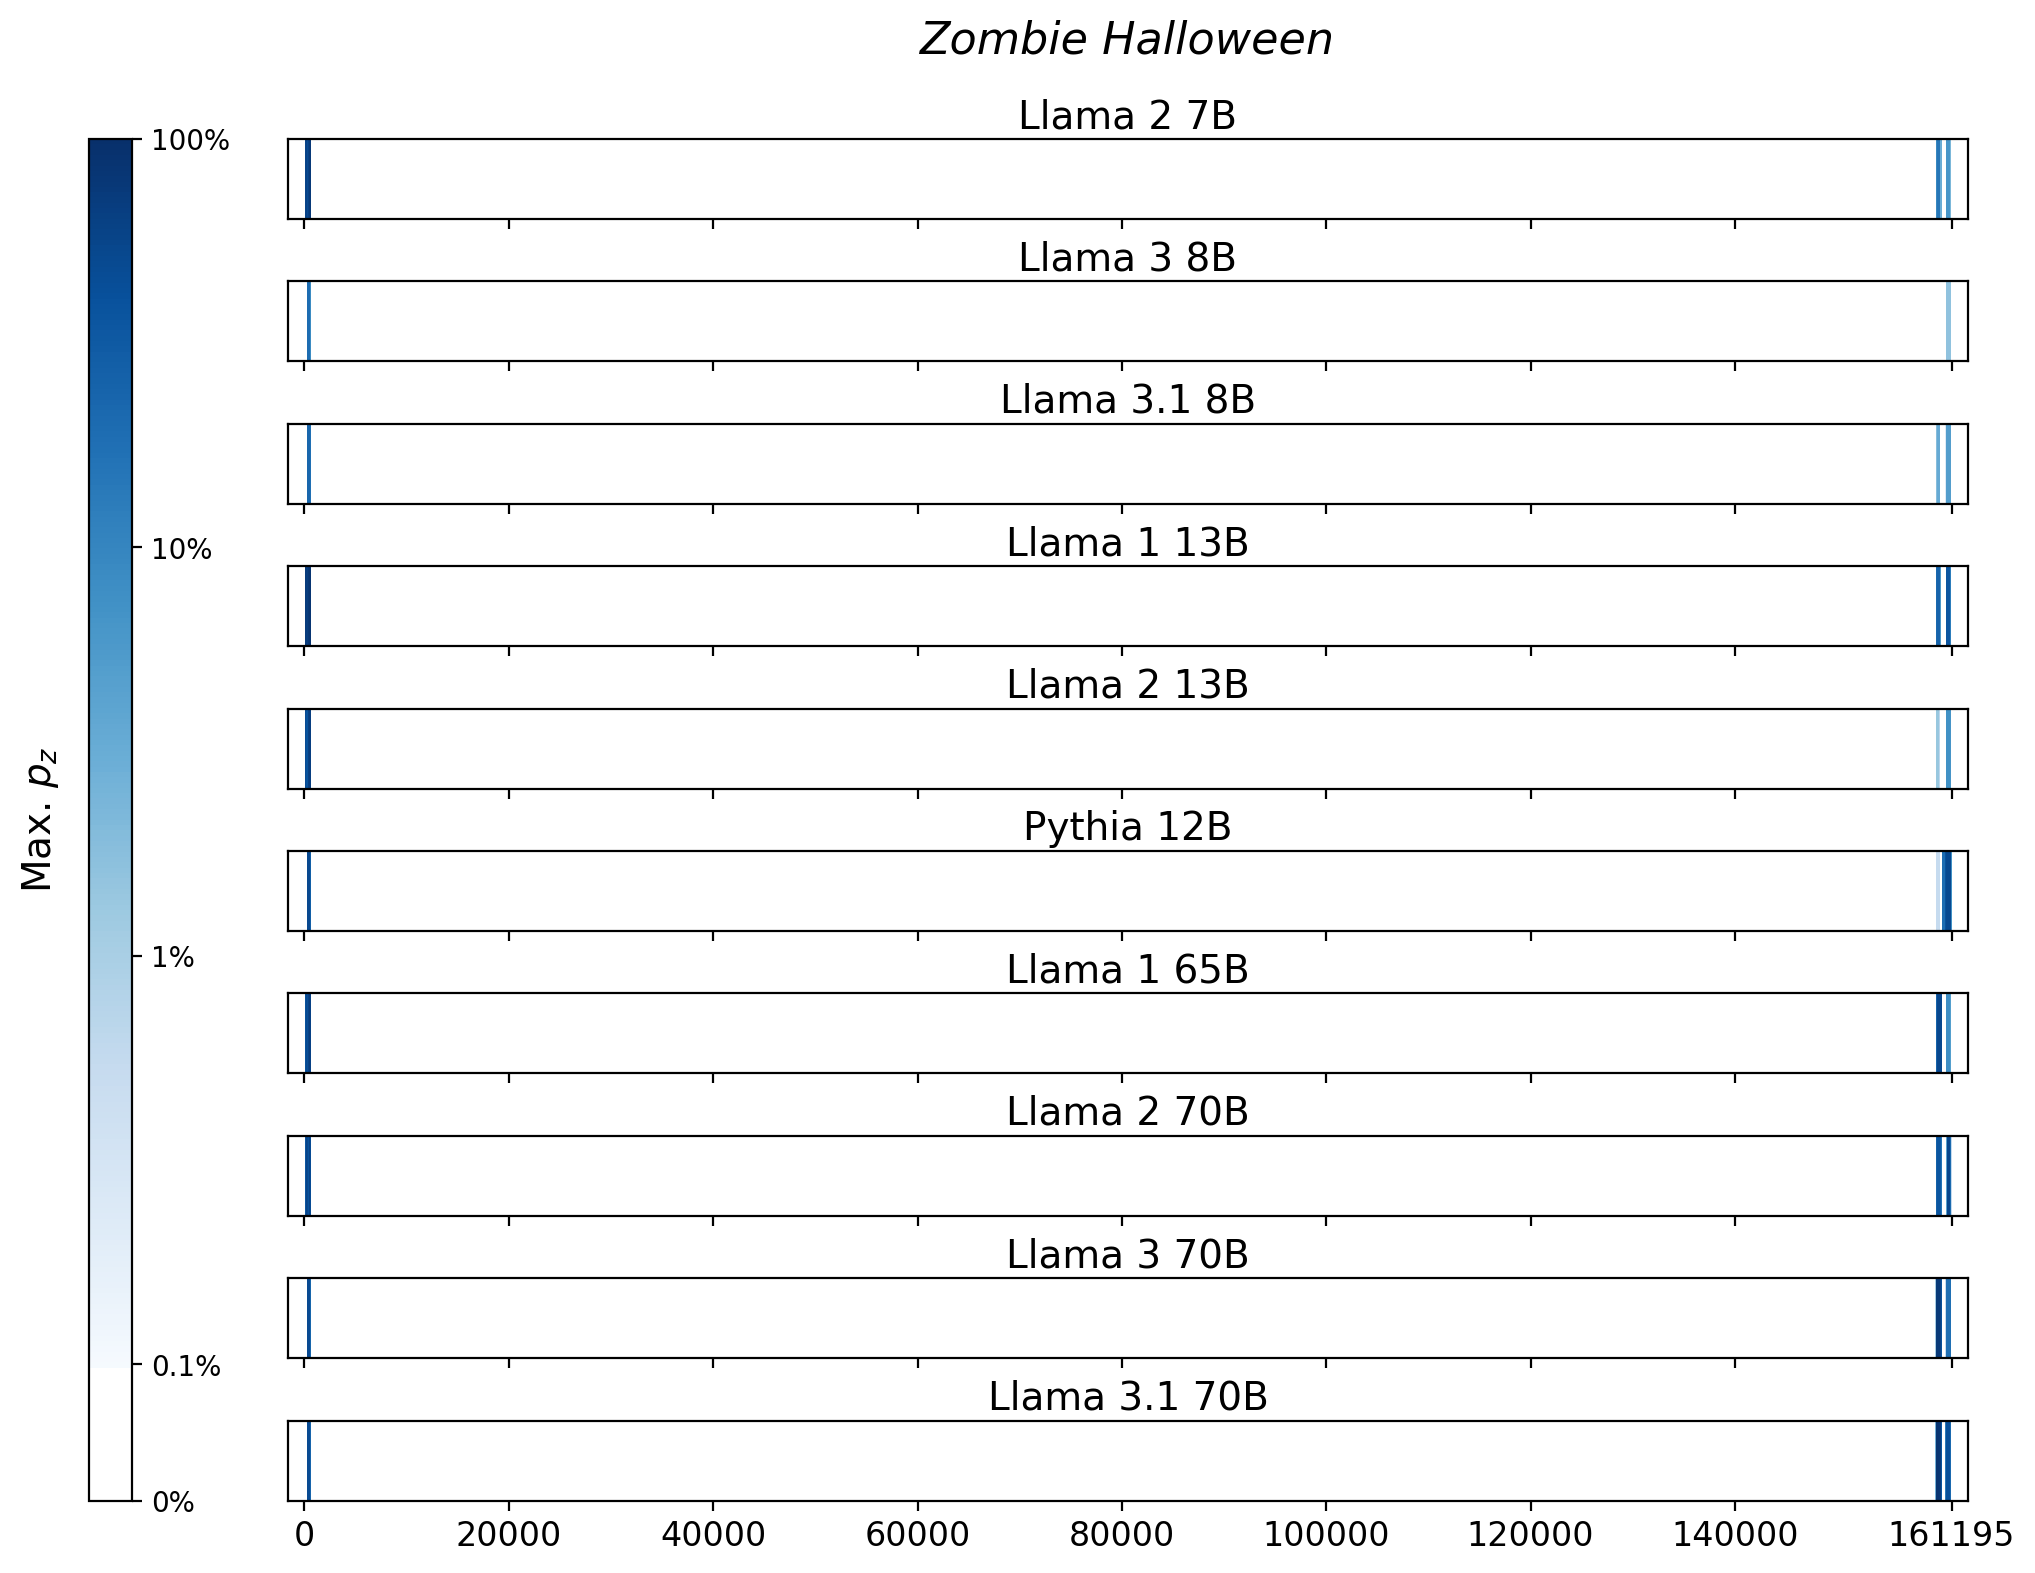
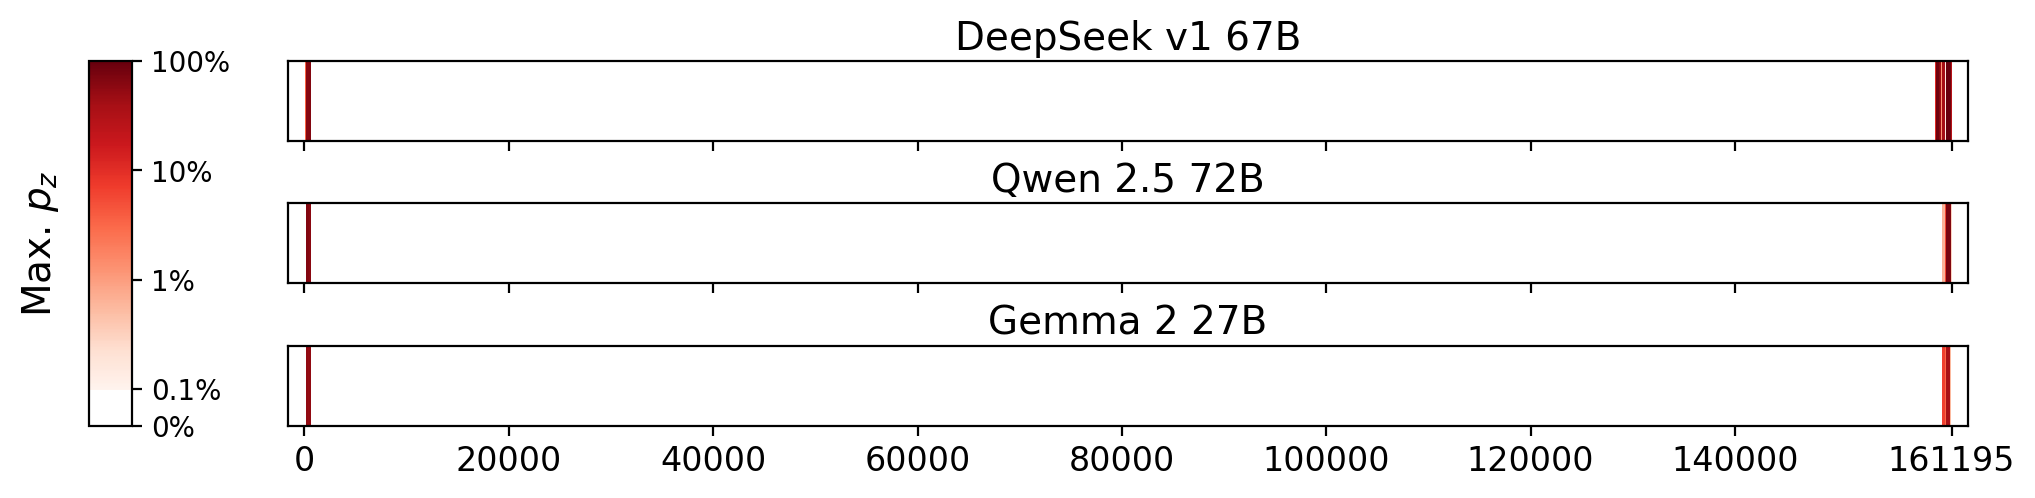
Each heatmap reflects results from an experiment on one model. At each character position, the color shows the maximum extraction probability among the overlapping 50-token suffixes that span that character. Darker means higher extraction probability, on a log scale. 🔍 Hover over a heatmap to zoom in.

Distributions over extraction probability
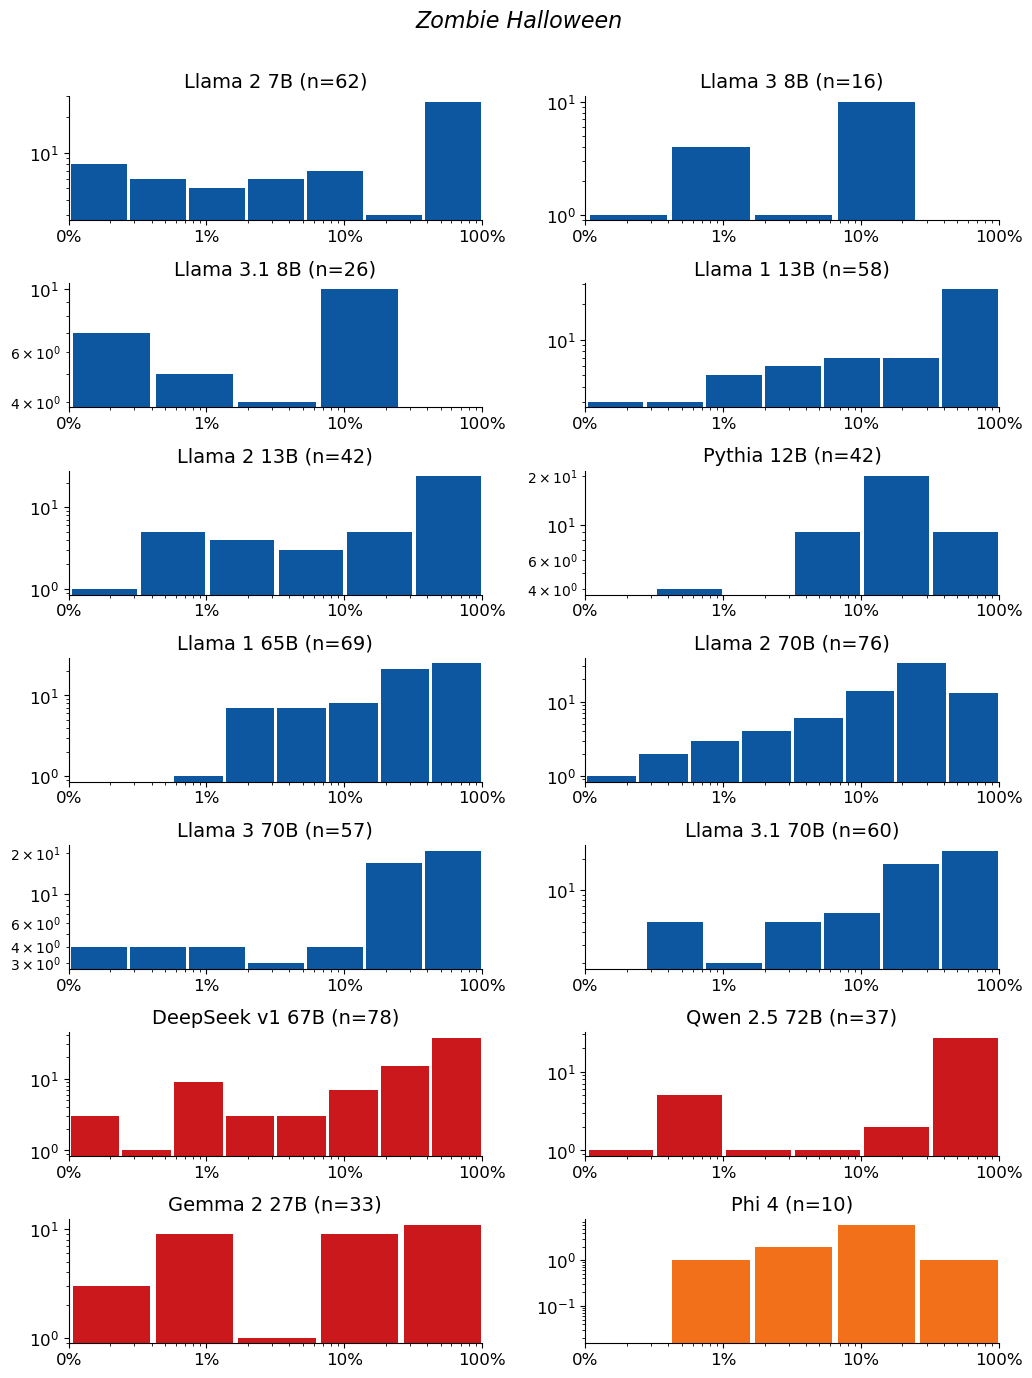
Each histogram shows the distribution of the 50-token sequences we extracted from a single model. n is the raw number of sequences we extracted from that model (for example, n = 40 means we extracted 40 sequences from it). The horizontal axis is extraction probability (log scale, as in the other plots); the vertical axis is a count — the number of extracted sequences whose probability falls in that bin — so the bar heights add up to n. Mass toward higher probability means more of the extracted sequences are highly extractable. If a model has no extractable sequences, its plot is left empty.